For commercial property developers, Family Entertainment Center (FEC) operators, and hospitality entrepreneurs, starting or expanding an arcade is one of the most lucrative ventures in the modern "retailtainment" sector. However, transitioning from a conceptual design to a highly profitable reality requires more than just buying popular machines and hoping for the best. It requires rigorous financial modeling, precise cash-flow projections, and an analytical understanding of unit economics.
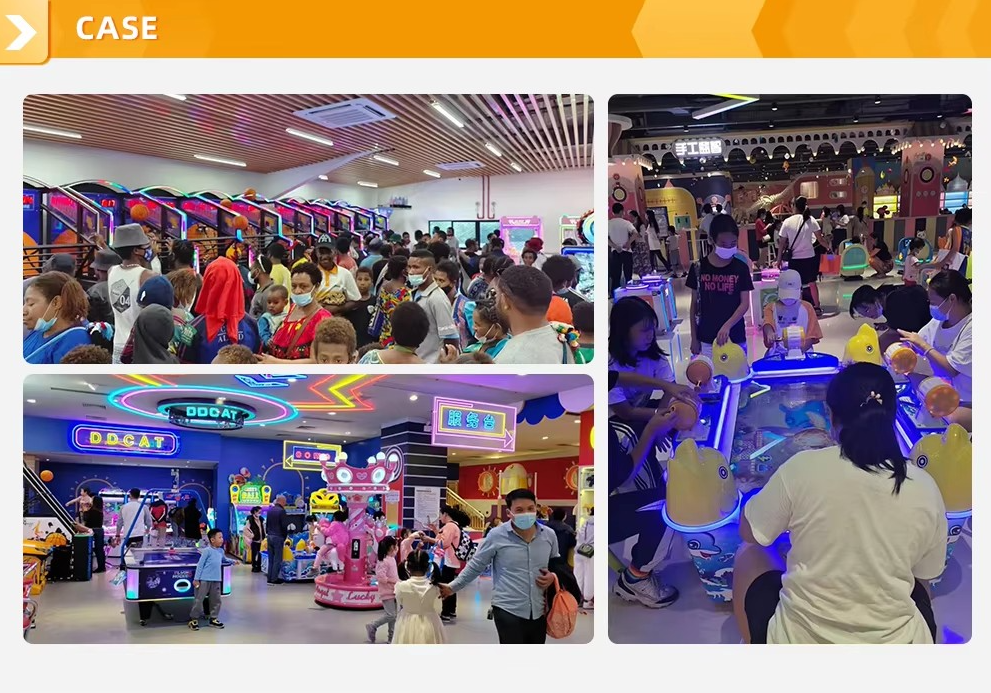
In the amusement industry, your equipment is not just entertainment—it is a fleet of automated, high-yield revenue-generating assets. At Funforward, we have spent nearly two decades bridging the gap between game engineering and financial viability. Founded in 2008 in Panyu, Guangzhou—the global epicenter for amusement research and manufacturing—we have helped over 350 entertainment centers worldwide design, install, and optimize their game zones.
This comprehensive guide serves as your professional Arcade Game Center ROI Calculator blueprint. We will break down the exact mathematical formulas, capital expenditures (CapEx), operating expenses (OpEx), and revenue drivers you need to build a bulletproof financial model for your arcade investment.
Before you can calculate your return on investment (ROI), you must master the fundamental metrics that dictate the cash flow of an amusement venue. Whether you operate a 1,500-square-foot boutique barcade in Chicago or a 20,000-square-foot regional FEC in Houston, these five metrics are the pillars of your financial calculator:
Foot Traffic / Footfall

Capture Rate (%)

Average Spendper Player

Payout Rate /COGS (%)

Net Operating Margin
This is the Average Revenue Per User. In the modern cashless era, players do not think in terms of quarters; they think in terms of digital credits or card taps.
The duration of a single game session.
For redemption games (which dispense tickets for prizes) and claw machines (which dispense plushies or electronics), COGS is determined by your payout rate.
This is the ultimate efficiency metric for commercial leaseholders. Rent is calculated by square foot or square meter, which means every machine must justify its physical footprint. High-performing multi-player units, like a 4-player island claw machine, are specifically engineered to maximize revenue per square meter by allowing four concurrent revenue streams in a compact, central-aisle footprint.
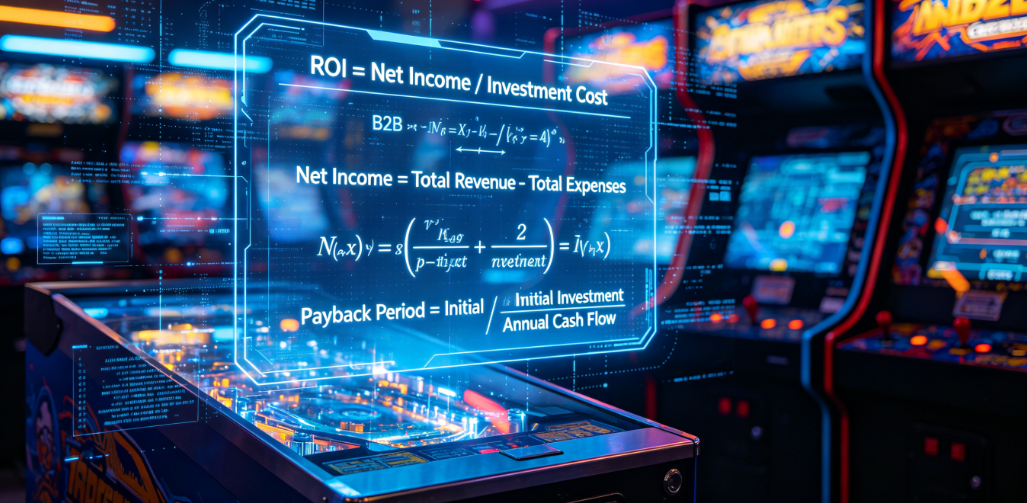
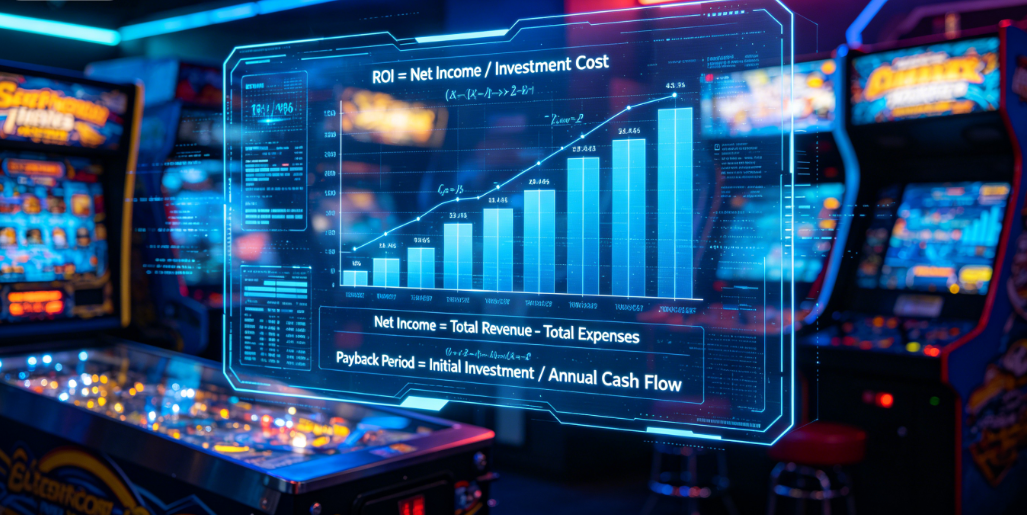
To build your custom ROI spreadsheet, you must program the following formulas. These equations represent the standard accounting logic used by professional amusement analysts.
To calculate how much money your game center will generate before expenses:
Where:
Example: A venue with 5,000 daily passing traffic, a 10% capture rate, and a $20 average spend will generate:
Your net income is what remains after subtracting the Cost of Goods Sold (prizes) and Operating Expenses (OpEx):
Where:
To evaluate the annual efficiency of your initial capital expenditure (CapEx):
Where:
The exact amount of time it will take for your cash flow to recoup your initial investment:
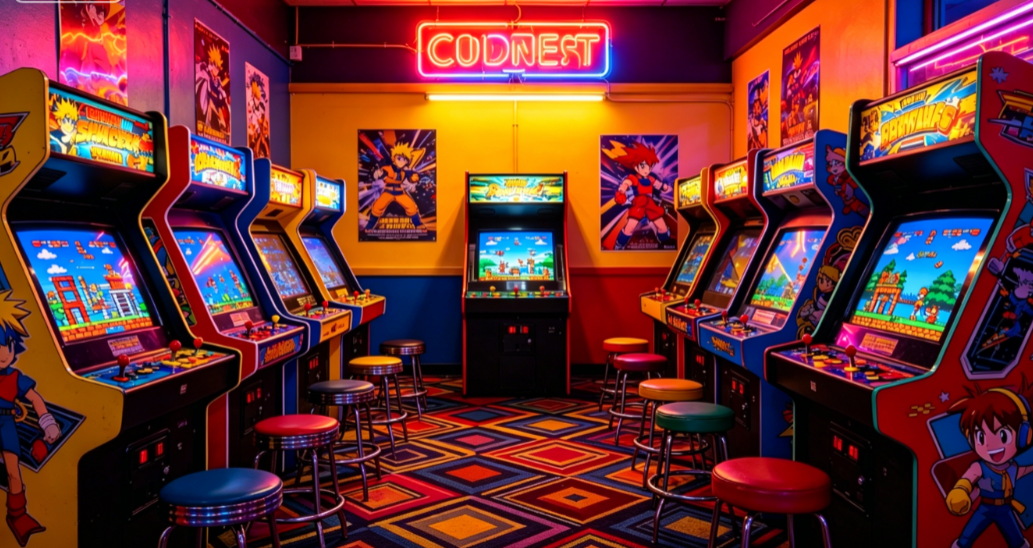
A successful game center does not rely on a single type of machine. Optimal financial health requires a diversified portfolio of equipment. Here is a breakdown of how different machine categories perform within an ROI calculator framework:
| Machine Category | Typical CapEx per Unit | Play Cycle Time | Gross Margin (%) | Target Payback Period | Financial Role in Venue |
|---|---|---|---|---|---|
| Claw & Toy Crane Machines | $1,500 - $3,500 | 45 Seconds | 70% - 80% | 3 - 6 Months | High Margin, fast recovery of capital. Highly attractive to families. |
| Professional Driving Simulators | $6,000 - $15,000 | 3 - 5 Minutes | 90% - 95% (No physical COGS) | 8 - 12 Months | Premium visual anchor, high ARPU, attracts competitive adult demographics. |
| Punching / Strength Testers | $2,500 - $4,500 | 30 Seconds | 95% (No physical COGS) | 4 - 6 Months | Extreme durability, low maintenance, high impulse play in bars/pubs. |
| 4-Player Island Crane Systems | $8,000 - $14,000 | 45 Seconds (x4) | 70% - 75% | 5 - 8 Months | Central aisle centerpiece. Maximizes revenue per square meter. |
| VR / Motion Platforms (9D VR) | $12,000 - $25,000 | 5 Minutes | 90% | 10 - 14 Months | Futuristic attraction, justifies high per-play tickets ($10-$15/play). |
Claw machines, particularly those featuring licensed plush toys or trending electronics, are the high-margin anchors of any venue. Because they require low initial capital, their payback period is incredibly fast.
While a professional driving simulator or a multi-screen motion driving simulator requires a higher upfront CapEx, its financial value lies in its power to attract high-spending adult demographics.
To illustrate how these formulas operate in a real-world business scenario, let us examine a simulated financial model for a 2,500-square-foot modern arcade venue located in a mid-to-high traffic US commercial district.
To launch this venue, the operator acquires a balanced mix of 50 machines from Funforward, utilizing our direct-factory pricing and consolidated sea freight.
| Expense Item | Description | Cost (USD) |
|---|---|---|
| Amusement Equipment (CapEx) | 20x Smart Claw Machines, 6x Professional Driving Simulators, 4x Punching/Boxing Games, 2x 4-Player Island Cranes, 4x Air Hockey Tables, 14x Ticket Redemption/Vending Units | $125,000 |
| Shipping, Customs & Logistics | Consolidated sea freight from Guangzhou Panyu to US West Coast | $18,000 |
| Interior Buildout & Electrical | LED neon aesthetic, heavy-duty electrical wiring, POS counters | $25,000 |
| Payment Integration | Nayax cashless reader systems for 50 terminals | $15,000 |
| Working Capital & Contingency | Initial prize stock, licensing, marketing, emergency cash reserves | $17,000 |
| TOTAL INITIAL INVESTMENT | Full Turnkey Capital Required | $200,000 |
An efficient, automated venue requires minimal hands-on labor. By deploying 5G-connected smart mainboards across all machines, the operator can manage the venue with a lean staffing model.
Monthly OpEx Breakdown(Total: $17,800)$7,500 - 42.1%)
Rent & Common Area Maintenance($7,500 - 42.1%)
Utilities & High-Draw Power($2,200 - 12.4%)
Labor: 1 Full-Time, 2 Part-Time ($5, 500 - 30. 9%)
General Insurance & Licensing ($1, 100 - 6.2%)
Marketing & Local Promotions ($1, 500 - 8. 4%)
In financial planning, relying on a single revenue projection is dangerous. We model three distinct scenarios—Conservative, Moderate, and Optimistic—based on varying player volume and average spend.
| Financial Variable | Conservative Scenario (Low Traffic) | Moderate Scenario (Target Average) | Optimistic Scenario (Peak Performance) |
|---|---|---|---|
| Average Daily Active Players | 80 | 150 | 250 |
| Average Spend per Player (ARPU) | $15.00 | $20.00 | $25.00 |
| Projected Daily Revenue | $1,200 | $3,000 | $6,250 |
| Projected Monthly Gross Revenue | $36,000 | $90,000 | $187,500 |
| Prize COGS (Managed at 22%) | $4,800 | $12,000 | $25,000 |
| Monthly OpEx | $17,800 | $17,800 | $17,800 |
| Net Monthly Operating Income () | $13,400 | $60,200 | $144,700 |
| Annualized Net Operating Income | $160,800 | $722,400 | $1,736,400 |
By matching these three scenarios against our initial $200,000 CapEx, we can determine the exact speed of your business's capital recovery:
[Payback Period Timeline comparison]Conservative: 14.9 Months[███████████████]Moderate (Target): 3.3 Months[███░░░░░░░░░░░░]Optimistic: 1.38 Months[█░░░░░░░░░░░░░░]Simply looking at a positive calculation is not enough. To ensure your venue performs at the "Moderate" or "Optimistic" level, you must implement specific, modern operational strategies that directly impact your metrics.
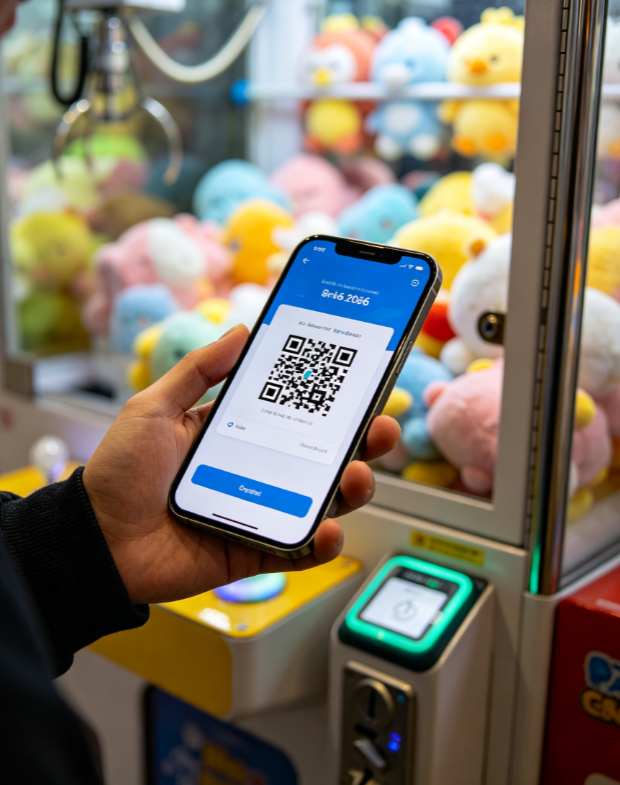
Cashless systems do more than just process credit cards. They allow you to create dynamic pricing models.
Your layout should act as a physical sales funnel.
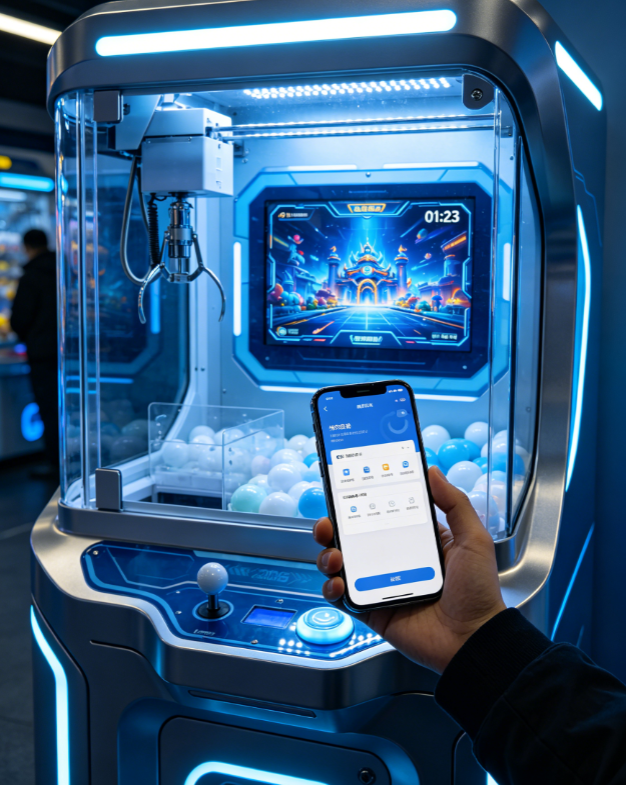
In 2026, manual collection and key-based audits are obsolete. Our equipment features smart mainboards that communicate directly with a cloud dashboard. This technology slashes your OpEx by:
Operating a successful arcade game center is a perfect marriage of high-tech entertainment and highly efficient, automated retail economics. Unlike traditional food and beverage franchises that require massive overhead, heavy staffing, and years to break even, a well-planned amusement venue offers one of the fastest, most predictable ROI profiles in the commercial world.
At Funforward, we do not just manufacture premium, CE and RoHS-certified arcade hardware. We provide complete, turn-key business systems designed to maximize your revenue per square meter. From our Panyu manufacturing base, we offer global shipping in export-grade reinforced crating, lifetime remote technical support, and comprehensive custom layout planning.
Are you ready to turn financial projections into a highly profitable reality?
[Inquiry Now to Receive a Free, Personalized 3D Venue Layout and a Customized ROI Projection Report for Your Location]
Copyright © Guangzhou Fun Forward Technology Co., Ltd - Privacy policy